
Previous Tests
The NLSI LUNAR team has proposed a telescope design that will be able to withstand the extreme conditions of the lunar environment, as well as be highly cost effective to deploy and operate. The photon collecting dipoles of the radio telescope array will sit upon long arms made of Kapton, an electrically insulating, flexible film. Below are the results and analysis of previous experiments on the Kapton film done in the LUNAR Simulation Laboratory. The experiments must replicate the environment of the lunar surface. This means that the Kapton must be exposed to pressures 100 trillion times lower than at sea level, subjected to temperatures between -150 and 100 degrees Celsius, and exposed to UV light during the daytime (hot) cycle. The objective section of each experiment explains what was measured during the test, and a brief explanation of why this is valuable to the LUNAR team.
ATHLETE Thermal Test
Started: April 2, 2012
Ended: April 5, 2012
Objective: The LUNAR (Lunar University Network for Astrophysics Research) team is collaborating with JPL's ATHLETE (All-Terrain Hex-Limbed Extra-Terrestrial Explorer) rover team to test the survivability of their rover in lunar nighttime conditions. This rover is designed to be a heavy lift utility vehicle, supporting human exploration on the lunar surface. Each limb requires multiple actuators to allow for six degrees of freedom in movement. These actuators are built of multiple components that can only operate at certain temperatures.
The LUNAR team has designed and started to implement a series of tests on a representative hip-pitch actuator to determine what is needed to keep its components warm enough to survive the lunar night. The first experiement in this series has been conducted to get baseline data on how heat flows through the actuator.
Data: The actuator consists of four main components: a brake, a field director, a three phase motor, and a gearbox. The brake requires 28V to disengage, and the motor accepts up to 28V to operate at maximum rpm. Two power supplies external to the chamber provided the power to these components. Only two motor windings were powered for these initial tests, so the axle was not actually spinning during this initial test. The team plans to build a driver to spin the motor for subsequent testing.
The team custom designed an aluminum mounting structure to fasten the actuator to the chamber thermal plate, and six thermocouples were attached to the actuator and the block to monitor heat flow. Sunlit lunar polar conditions were simulated using the LSL located at the University of Colorado Boulder. The Ultra High Vacuum (UHV) chamber was used for this initial thermal experiment. Although the target temperature for the actuator was –135° C—the temperature ATHLETE would reach in a sunlit lunar polar region—the lubricants inside the gearbox could not go below –80° C. To accommodate this requirement, the experiment was designed to determine the voltages required to keep the gearbox above –80° C while stepping the temperature of the mounting structure down to –135° C.
There will be four testing phases to determine what the heat transfer is like when different components are turned on or off. Each test will begin by bringing the motor into thermal equilibrium at -70 degrees C. Thermal equilibrium is established when there is less than a 2 degree temperature change in half of an hour.
- Phase 1 of the test will be to open the brake to the motor. The brake is opened by applying 28V across it. The team will determine at what temperature the motor reaches thermal equilibrium.
- Phase 2 will begin after the brake is turned off and the motor cools back down to -70 C. Then, an initial voltage of 28V will be applied to the brake to open it. After only a few seconds, the brake will be stepped down to only 13V, which is the minimum voltage required to keep the brake open. Again, the team will see what the equilibrium temperature is with this configuration.
- Phase 3 will begin in the same way as phase 1. The brake will be turned on at 28V. The windings in the motor will also be powered. First, the team will turn them on at 0.5V, and determine what the equilibrium temperature is. After it has been established, the voltage will be increased at 0.5V increments until the maximum 3.0V limit is reached. After each voltage increase, the motor will establish thermal equilibrium for at least half an hour until the next voltage increase.
- Phase 4 will be a repeat of phase 3, with the exception that the brake will be powered at 13V instead of the full 28V.
Analysis: A plot of the temperature data taken by a thermocouple located on each of the various components is shown below. The first temperature spike corresponds with phase 1 of testing, the second spike corresponts to phase 2, and so on. The peak between days 1.5 and 2 occured when the team turned off the cryogenec system during testing.
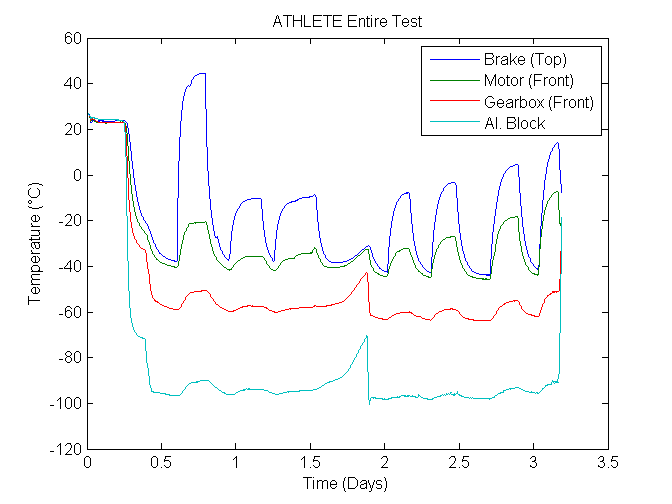
Figure 1. Shows the thermocouople data from the entire test taken at various places on the unit.
The first peak, phase 1 of testing, shows a rapid temperature increase on the motor break. This occured when the maximum voltage was applied to the brake. The temperature of the brake increased from -37.9 C to 44.7 C in just over 5 hours. It was expected that the brake be one source of heat for the actuator, but this temperature increasehas far more of a contribution than predicted. However, this steep increase was only seen when the brake was powered at it maximum voltage. In subsequent phases of testing, the brake was opened at a lower voltage and the voltage was dropped after the initially opening down to a 'holding voltage' to conserve power. So, while the thermal contribution of the brake to heateing the whole assembly is accessible, it is unclear that the ATHLETE rover will have the ability to utilize the brake in this way.
Comparing the temperature of the other components to the brake during phase 1, it is clear that while the brake generates more heat than expected, the heat flow through the various components is minimal. The goal is to keep the gearbox as warm as possible to reduce wear and tear on the internal components and maximize lifespan. As is shown in figure 2, below, although the break and motor showed significant increases in temperature as the motor drew more power, the gearbox was only slightly influenced. The difference between the maximum temperature of the gearbox between the two cycles was only 6.2 degrees. So, though the brake and other components are generating more heat than predicted, the ATHLETE rover will have to find some sort of heat flow mechanism to take advantage of that source.
Figure 2. While the temperature range for the brake is significant during these two testing phases, the gearbox shows minimal thermal transition.
Conclusions and Future Work:The maximum increase in the gearbox temperature was only 12.5° C. Based on this preliminary test, it does not appear that the actuator will be able to maintain operating temperatures in a lunar polar region with the brake operating at its minimum releasing voltage.
Modifications to the experimental setup will be made because the actuator did not reach the target temperature, and it had a steep thermal gradient from the top of the brake to the mount. Additionally, we must maintain the clean conditions inside the UHV chamber for sensitive equipment, preventing us from allowing the actuator to rise above the tested outgassing temperature.
Future experiments will be conducted in our Lunar Simulant chamber. As we are not as concerned about contaminating this chamber, we can let the temperature of the actuator exceed 50° C. Thermal transfer will be improved by modifying the mounting structure to reduce the amount of material between the actuator and the thermal table. The thermal gradient on the actuator—caused by radiative heating from the chamber walls—will be greatly reduced by making use of a cooled thermal shroud, effectively shielding the actuator from outside heat sources.
Beyond this, future goals for more realistic testing include:
- A driver to interface the field director and motor windings so we can run the gearbox
- Hooking the actuator to a load
- Simulate equatorial daytime conditions at 100° C with UV radiation
To view a link to the ATHLETE JPL website, click here.
Micro-Rover Engineering Demonstration
Started: July 13, 2011
Ended: July 15, 2011
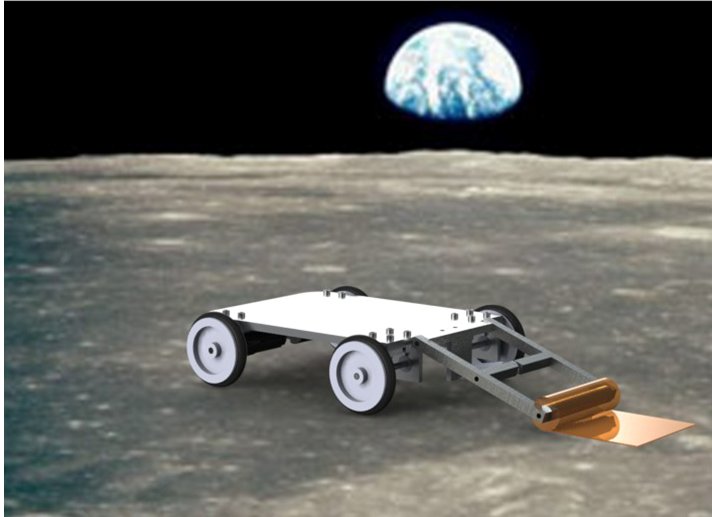
Objective: The LUNAR array has been designed to be easily deployable by simple lunar rovers. To save on cost, these rovers will be made out of 'off the shelf' materials, which are approved for spaceflight but manufactured commercially*. The LUNAR team designed and built a micro rover made of such materials, to deploy a strip of Kapton inside the vacuum chamber. The team needed to determine if such a low cost vehicle would be functional in the lunar environment. The team deployed the strip of film during daytime conditions and drove it around at subsequent intervals during each daytime cycle for the duration of the test. During the nighttime cycles, the rover was parked on a platform that would partially insulate the motors from the extremely cold temperatures of the simulated lunar surface.
Data: The data from this demonstration comes from the video files captured while driving the rover. The team needed to show that the rover could drive around during daytime conditions. The team also showed that when the rover was parked properly for the lunar night, it could drive again during the next lunar daytime cycle. During the last nighttime cycle, the team drove the rover to determine if would still drive at these cold temperatures. That video file shows the motors functioning to turn the wheels of the rover, but the rover struggled to turn and be fully operational. The video files have been shared on YouTube and the links are listed below.
Watch the Deployment Video HERE
Watch the first Rover Drive Video HERE
Watch the second Rover Drive Video HERE
Conclusions: The successful deployment and subsequent test drives of the micro-rover demonstrate that it is possible to build and operate a low-cost, functional lunar rover. The micro-rover did not exceed its low budget, and all the components were manufactured commercially, not specially designed by the LUNAR team. Its failure to operate in the nighttime was expected due to the extremely low temperatures. However, the rover was able to drive successfully during the next daytime cycle, proving it can survive the lunar night.
![]()
*The LUNAR team would like to thank Maxon Precision Motors for their contributions and efforts to making this experiment a success.
Embedded Resistor Test
Started: June 6, 2011
Ended: July 3, 2011
Objective:  The LUNAR team conducted an experiment designed to determine how an internal resistor embedded within the array will degrade over a simulated lunar year. The resistor simulates the transmission lines between the photon-collecting dipoles sitting upon the telescope arms made of insulating Kapton film. The electronics unit tested in this experiment consisted of a 275 Ohm resistor embedded in a piece of Kapton film. This unit was attached to a copper-coated sheet of Kapton, which simulates the body of the telescope. The resistance of the unit was measured at one minute intervals using an external ohmmeter.
Data: Two types of data were collected during the experiment to measure the degradation of the embedded resistor. The first was to take digital photographs of the unit both before and after the experiment. With those images, the team measured the dimensions of the resistor and the insulating Kapton. The team needed to verify that the different thermal expansion and contraction rates of the insulating Kapton film and the embedded resistor did not create bubbles or warps in the unit. The second kind of data that was collected during the test was the resistance of the unit to see if there were any increases over the duration of the experiment. Large resistance increases would signify that the temperature fluctuations and solar wind exposure on the lunar surface would cause significant damage to the transmission lines in the telescope over a lunar year.
Analysis:
The electronics unit was photographed under 4X magnification both before and after the experiment was conducted. The dimensions of the unit were measured to look for changes that might lead to a reduced signal transmission in the LUNAR array. Here is an image of the unit before it was inserted into the LUNAR Simulation Laboratory's vacuum chamber.

The white boxes give the lengths of the white lines measuring the dimensions of the unit (in pixels). The same area of the resistor was imaged again after the experiment at 4X magnification (shown below). The after images of the electronics unit show that there are no visible rips, tears, bubbles, or other warps in the internal resistor or the insulating Kapton film. The grainy material is the resistor and the clear material is the Kapton film.

These two images were stacked and aligned in order to subtract the intensity of each pixel in the after image from the before image. Since care was taken to ensure that the background light levels were the same for both images, the subtaction highlights the differences between the two pictures. The subtracted image is shown below.

The red circles show several anomalies identified by the LUNAR team as dust particles or adhesive residue left on the after image after the resistance unit was removed from the vacuum chamber. The bright area in the green box is an image of the lamp underneath the microscope illuminating the Kapton film on the after image. Since the grainy structure of the resistor part of the unit is uniform throughout the image, the LUNAR team concludes that there have been no structural changes to the resistor during the experiment. There is no evidence that suggests that the Kapton film has warped or delaminated from or the embedded resistor.
A photomicroscopy software program was used to calculate the distance between two points on an image taken by the microscope. Several areas of the resistor were imaged, and the dimensions of a few features were measured per photo. At least three independent measurements of each dimension were taken per photo, and three images of each region of the unit were taken and averaged to ensure accuracy. For example, the images above show the center of the resistance unit. There are 5 features measured in these images. The feature in the bottom left has four independent measurements of the width of the Kapton film.
Analysis of the dimensions of the resistance unit show that there is no statistically relevant changes from before and after the experiment. The maximum change in dimension from before to after the experiment was a mere 3%. This shows that the Kapton in the LUNAR array will not suffer problems from delamination caused by the harsh lunar environment. The percent changes in aspect ratio of the embedded resistor are summarized in the table below.
|
Before-After Dimension (mm) |
% Change | |
| Center A | 0.01124 | 1.75 |
| Center B | -0.00501 | -0.71 |
| Center C | 0.02237 | 3.11 |
| Center D | 0.07162 | 1.01 |
| 2nd Division A | 0.01927 | 3.11 |
| 2nd Division B | 0.01036 | 1.45 |
| 2nd Division C | 0.01847 | 2.89 |
| 4th Division A | 0.00914 | 1.39 |
| 4th Division B | 0.00499 | 0.70 |
| 4th Division C | 0.00029 | 0.04 |
| 7th Division A | 0.01234 | 1.82 |
| 7th Division B | 0.0009 | 0.01 |
| 7th Division C | 0.00698 | 1.12 |
The resistance of the electronics unit was measured continually throughout the experiment to monitor any internal degradation. The team conducted a baseline reading before testing started to determine the noise level of the data. The resistance of the unit inside the chamber at room temperature and atmospheric pressure was measured. This test determined what level of fluctuation is normal for the resistor, and what level would signify that it had undergone significant degradation. The baseline test lasted for four days, ensuring that there were enough data points to have an accurate baseline level. The average resistance of the unit during this test was 278.63 Ohms, with a standard deviation of 0.035 Ohms.
The plots below show the culmulative resistance and temperature data taken during the experiment. They show that there is a strong correlation between the temperature of the environment and the resistance of the heater. The resistance was at its highest values during daytime cycles, and at its lowest values during nighttime cycles. This agrees with electrodynamics equations, where an increase in temperature leads to an increase in resistance. However, the plots show no overall trends in resistance throughout the test. The unit had a maximum fluctuation of only 0.7% between daytime and nighttime cycles. The steadiness suggests that Kapton will provide sufficient insulation for the LUNAR array.


To further demonstrate that there were no overall trends in the resistance data, all of the daytime and nighttime resistance values were grouped together. The two plots below show the resistance values from all the hot and cold cycles of the test, respectively. The plots all begin when the thermal plate inside the vacuum chamber first reached the temperature of the lunar surface; 100 C for a daytime cycle and -150 C for a nighttime cycle. The plots do not show the resistance values during the transition from daytime to nighttime cycles.


The hot and cold cycles all have the same shape, suggesting that the rate of heating and cooling is approximately equal for all cycles. The standard deviation was +/- 0.08 Ohms for the daytime cycles and +/- 0.1 Ohms for the nighttime cycles. The scatter is sufficiently small enough to be caused by random statistical fluctuations.
Conclusions: The Kapton film provided adequate electrical and thermal insulation from the simulated lunar environment. There were no increases in resistance seen over the duration of the experiment due to UV exposure. The resistance changed minimally with temperature, but no overall trends were seen from one daytime or nighttime cycle to the next. The Kapton also provided enough thermal insulation to keep the expansion and contraction of the embedded resistor from warping or delaminating from the film. Based on these results, Kapton continues to be the main structural material for the LUNAR array antennas.
Deployment Simulation Test
Started: June 4, 2010
Ended: July 1, 2010
Objective: The LUNAR team conducted a month long test to determine the effect of thermal cycling on Kapton film. The film was initially wound around a roller and then unwound under nighttime conditions to simulate the radio array's deployment. The temperature of the film was monitored to measure the degree of insulation that the film will provide to the array's electronics. The conductivity of a special copper coating was also measured throughout the experiment. The copper simulates the photon collecting dipoles on the array.
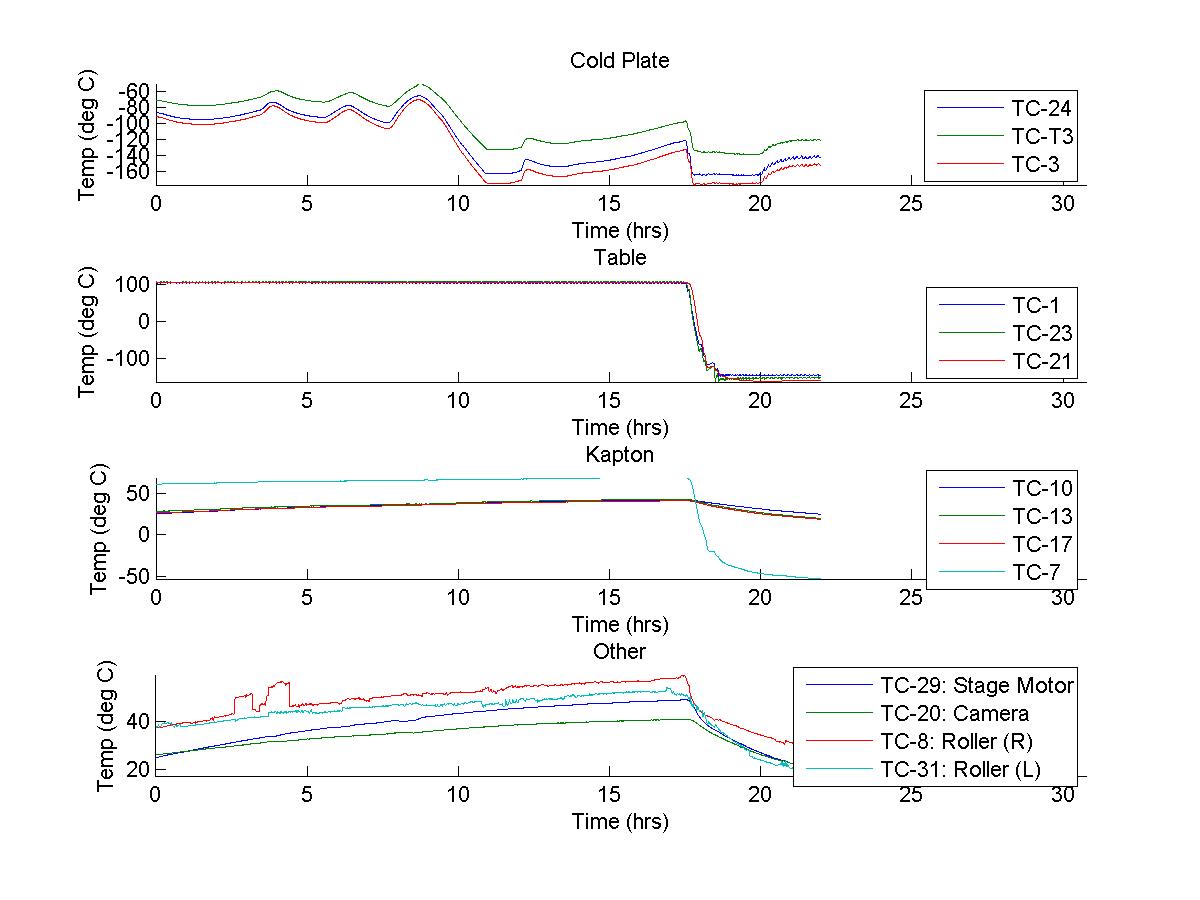
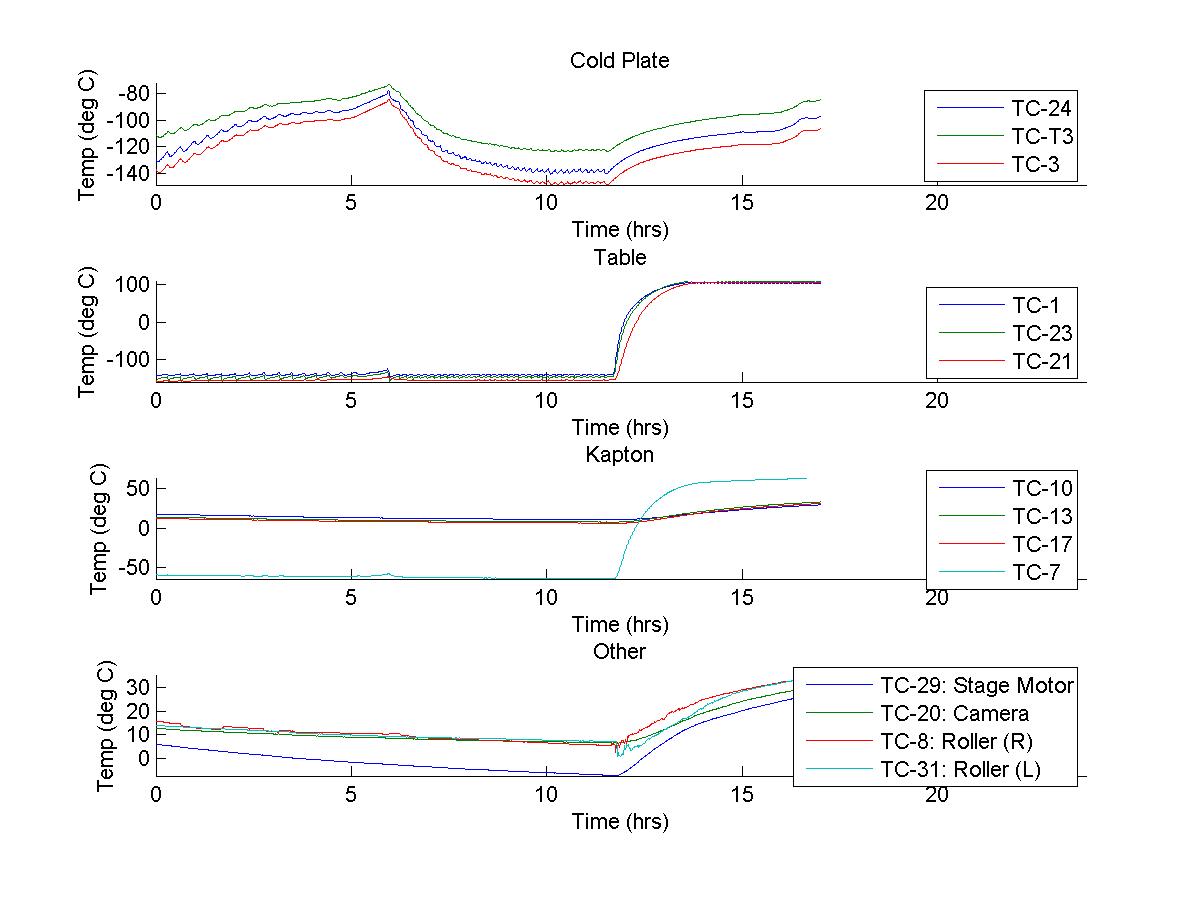
Data: Several thermocouples were strategically placed throughout the chamber to monitor the temperature fluctuations of the various components, as well as measure the degree of insulation that the film provided. A sample of the temperature readings as the chamber was cycled from day to night is shown below.
Day 5
Start: 6/8/2010, 13:05 MDT
End: 6/9/2010, 11:03 MDT
Cycle: Daytime to nighttime
Raw Data Day 5
The thermocouples monitoring the thermal transfer of the Kapton film are labeled as TCs 10,13,17, and 7. Clicking the Raw Data link will take you to a table of the actual temperature readings of each thermocouple taken at one minute intervals during the time interval shown in the graph above. A sample of the data taken while the chamber was cycled from a night to a day cycle is also shown below.
Day 18
Start: 6/21/2010, 18:37 MDT
End: 6/22/2010, 11:37 MDT
Cycle: Nighttime to daytime
Raw Data Day 18
Analysis: The film was successfully unwound on day 1 of the test. The chamber temperature was -150°C and the film reached -70°C. The film was unwound approximately 20 centimeters, and temperature and conductivity measurements began.
This image was taken during the unrolling process. You can find the YouTube video of the deployment simulation HERE.
The temperature changes of one full day and night cycle are shown here.

The graph shows the temperature readings from four sensors inside the chamber. Three were attached to the segment of the film that was unrolled at the beginning of the test. The fourth sensor was placed on a small piece of film firmly secured to the thermally conductive plate. The maximum temperature swing of the first three sensors during this period was 37°C, while the fourth sensor had a change of 131°C.
Several equations were used to model the heat transfer between the Kapton film and the thermally conductive plate prior to the experiment. These models predicted that the temperature would transfer much more rapidly than is seen in the data. The Kapton film did not reach the expected extremes due to lack of solid contact with the table. This is a more accurate representation of how the film will change temperature on the lunar surface, since there will be little gravity or other forces pressing the Kapton down.
The electrical conductivity of the Kapton was measured continuously throughout the experiment with an external multimeter. If the conductivity deteriorates, then the electronics must be able to recognize and calibrate that change during data collection. Two filtering methods were used on the raw conductivity data to look for any trends. The first method was to reject all signals with frequencies above 100 cycles/day. The second method was to reject all data which falls outside of a range of resistances. This range was found by testing cycled and uncycled pieces of Kapton in a more ideal environment. Both methods produced similar results, shown below.


The conductivity of the copper coating showed weak correlation with the temperature of the Kapton. The thermal cycling and exposure to ultraviolet light increased the conductivity of the copper by 9.3%, from 82.6*106 S/m to 90.3*106 S/m. The increase in conductivity was most likely caused by outgassing of impurities in the copper coating.
The initial and final tensile strength of the film was measured by an independent company. A tensile load was applied to samples of Kapton film, both before and after it was cycled in the vacuum chamber. The modulus of elasticity and tensile strength of the film were compared. The results of this test show that the maximum elongation of the film increased by 16.7%. The elasticity decreased by 25.5%, and the tensile strength decreased by 8.7%. These changes are within the acceptable limits of degradation over a one year period. The results this test of both before and after cycling are shown below.


Conclusions: The thermal modeling results gathered by this experiment are favorable for future Kapton use because the Kapton will insulate the electronics from extreme temperature swings. The electrical conductivity of the Kapton showed very little degradation due to thermal cycling and exposure to ultraviolet light. However, the increase in conductivity needs to be confirmed. Based on these results, the LUNAR team can continue to consider Kapton as the framework material in the design of the LUNAR telescope.
Please investigate the following links for more information:


